/
Colocation Manager
Colocation Manager
- HostBill (Unlicensed)
- HostBill
- HostBill
Owned by HostBill (Unlicensed)
Last updated: Apr 19, 2018 by HostBill
Overview
Colocation Manager one of most powerful HostBill modules and an extremely rich-featured tool to help you store and manage Servers, Switches, PDUs, KVMs, Blade Systems, Zero-U devices and more.
Activating the module
- If the plugin is included in your HostBill edition you can download it from your client portal.
- If the plugin is not included in your HostBill edition you can purchase it from our marketplace and then download it from the client area.
- Once you download the plugin extract it in the main HostBill directory.
- Go to Settings → Modules, find and activate Dedicated Servers Manager plugin.
- Once the plugin is activated you will be directed to Settings→ Modules→ Plugins to configure the plugin.
Initial Module Configuration
- Choose module display name
- Select if you want the module to be accessible for all staff members or only selected staff members
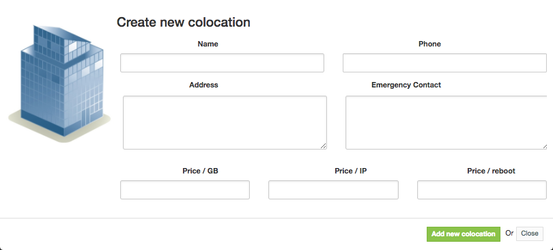
Then you can proceed to adding your olocations:
Adding PDU control to customer account
- Under Settings → Modules find and activate PDU_SNMP module
- Proceed to Settings → Apps and define SNMP connection using PDU_SNMP module
- From the list of supported device manufacturers select your device
- Provide SNMP read & write community
- Use Test Connection to check whether HostBill can connect to your PDU
- Repeat the steps above for each PDU you wish to control
- Proceed to Plugins → Dedicated Servers Manager → Inventory templates
- Select inventory items that will represent your PDUs
- Ensure those items have PDU App as an additional atribute
- Proceed to Plugins → Dedicated Servers Manager → [Your Rack]
- Select/Add PDU item on your rack
- From Hardware Tab, select App defined in previous steps
- Use Load ports to load ports from your device
- Save changes for your item
- Proceed to Orders & Accounts → Accounts, select customer account of Type: Colocation/Dedicated server
- Under PDU tab, select PDU & ports that this account/server is attached to
- You will now have control over customer PDU ports
Adding PDU reboots to client portal
- Connect PDU ports to customer accounts using steps above
- Proceed to Settings → Products & Services
- Select product of Type: Colocation / Dedicated Servers
- Proceed to Client Functions tab
- Enable PDU Reboots Client function
Adding Switch control to customer account
- Under Settings → Modules find and activate Switch_SNMP or Switch_Telnet module
- Proceed to Settings → Apps and define SNMP connection using Switch_SNMP or Switch_Telnet module
- From the list of supported device manufacturers select your device
- Provide SNMP read & write community (for SNMP) or username/password for Telnet
- Use Test Connection to check whether HostBill can connect to your Switch
- Repeat the steps above for each Switch you wish to control
- Proceed to Plugins → Dedicated Servers Manager → Inventory templates
- Select inventory items that will represent your Switches
- Ensure those items have Switch App as an additional atribute
- Proceed to Plugins → Dedicated Servers Manager → [Your Rack]
- Select/Add Switch item on your rack
- From Hardware Tab, select App defined in previous steps
- Use Load ports to load ports from your device
- Save changes for your item
- Proceed to Orders & Accounts → Accounts, select customer account of Type: Colocation/Dedicated server
- Under Switch tab, select Switch & ports that this account/server is attached to
- You will now have control over customer Switch ports
Connecting to Cacti / Observium for bandwidth billing
- Under Settings → Modules find and activate Cacti or Observium module
- Proceed to Settings → Apps, add new Cacti or Observium App connection
- Make sure to follow oncreen guide to upload API file to your Cacti or Observium server
- Provide admin username & password
- Use Test Connection to check whether HostBill can connect to your Cacti or Observium app
- Proceed to Settings → Products & Services
- Select product of Type: Colocation / Dedicated Servers
- Under General tab configure your Bandwidth/Overage billing settings
- Under Connect with App select Cacti or Observium and connection defined in previous steps
- Under Client Functions you can enable Bandwidth usage graphs for clients to track graphs in client portal
- Save changes
- Proceed to Orders & Accounts → Accounts, select customer account of Type: Colocation/Dedicated server
- Under Bandwidth Tab click enable, and select Device/Ports to assign graphs to account & (optionally) bill for them
Connecting to Nagios
- Under Settings → Modules find and activate Nagios module
- Proceed to Settings → Apps, add new Nagios App connection
- Provide Nagios username & password
- Provide URL to your Nagios (URL to cgi-bin directory)
- Use Test Connection to check whether HostBill can connect to your Nagios
- Proceed to Plugins → Dedicated Servers Manager → [Your Rack]
- Using [Refresh] function you can fetch latest monitoring outputs from Nagios
- HostBill tries to match devices from Nagios using hostname/labels, so make sure those match in Colocation Manager and Nagios
- If you wish your clients to have access to Nagios output as well:
- Proceed to Settings → Products & Services, select your colo/dedi product
- Under Connect with App add new connection, select Nagios module & app
- Under Client functions enable Monitoring function
- Proceed to customer account details in Orders & Accounts
- Under Dedicated Srv Manager assign item related to the customer account
Image uploads for Inventory Templates
If image/item icons uploads in Inventory Templates is not working for you, please ensure that/includes/modules/Other/Dedimgr/admin/images/hardware have chmod 777
Enabling Top Bandwidth usage list plugin
- Ensure that guides above regarding Cacti/Observium are finished
- Under Settings → Modules find and activate Top Bandwidth usage list module
- Module will now be accessibe from Plugins menu
, multiple selections available,
Related content
SolidCP
SolidCP
More like this
Hestia CP
Hestia CP
More like this
cPanel
cPanel
More like this
Cloud Monitoring
Cloud Monitoring
Read with this
Hetzner Cloud
Hetzner Cloud
More like this
SynergyCP
SynergyCP
More like this