You can find this section in HostBill Admin → Extras → Statistics & Reports.
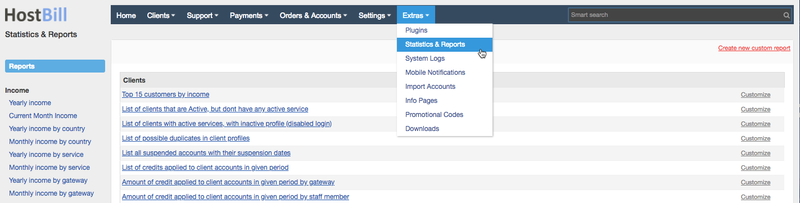
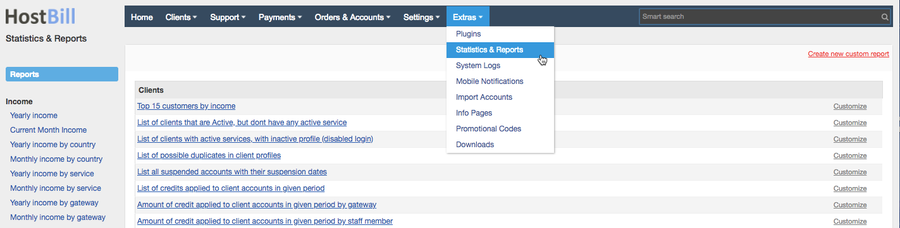
Statistics
HostBill gives you access to statistics related to the income, sign-ups and support tickets. You can choose the period of time for which you want to display the statistics.
Income statistics
Income statistics display data related to your income. Please note that these are gross income statistics and do not include gateway fees. Available statistics include:
Yearly income
Current Month Income
Yearly income by country
Monthly income by country
Yearly income by service
Monthly income by service
Yearly income by gateway
Monthly income by gateway
- Monthly revenue by App
- Yearly revenue by App
Sign-up statistics
Yearly Sign-ups
Current Month Sign-ups
Yearly Sign-ups by country
Monthly Sign-ups by country
Support tickets statistics
Reports overview
HostBill allows you to generate various reports, either using pre-defined templates that can also be customized or optionally you can create your own report based on your individual needs.
All core HostBill reports are in fact SQL queries in HostBill database. After executing query Report module takes care of displaying results in one of the admin-defined output: HTML, PDF, CSV, JSON, SQL or Plain Text. If you or your staff members are familiar with SQL you can easily customize existing HostBill reports or build your own from scratch.
By default HostBill comes with dozens of pre-installed reports - those reports cannot be removed. If you find that some report is missing some important data, or is a good starting point for your custom report, you can customize it.
Report Groups
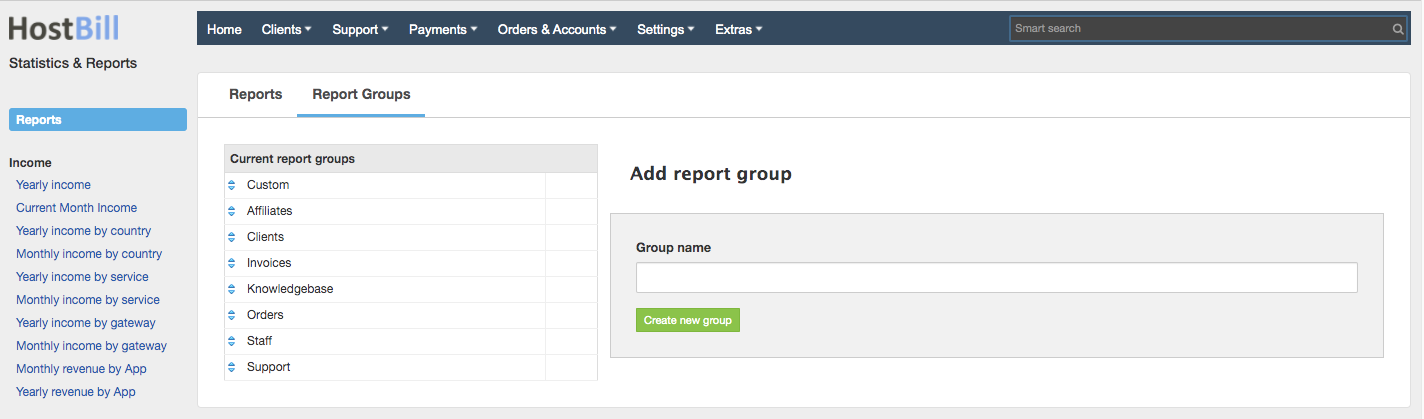
All reports are divided into six categoriescategories/groups. By default reports are assigned to following groups:
- Clients
- Invoices
- Orders
- Staff
- Support
- Custom reports
- Affiliates
- Knowledgebase
You can also create you own groups simply by clicking on "Create new group" button and add or assign existing reports to the group (by customizing given report).
Please note:
- To be able to create new report group a staff member will need a relevant ACL: Manage report groups
- When a new report group is created HostBill will create new ACL available for staff members: Access Reports: GroupName and Customize Reports: GroupName
- Deleting the report group will result in moving all reports from this group to "Custom" group
- Default report groups can't be deleted
Customizing reports
To customize a report choose the report from the list and click on Customize button on the right. You will see a silimilar screensimilar screen with various configuration options to customize the report: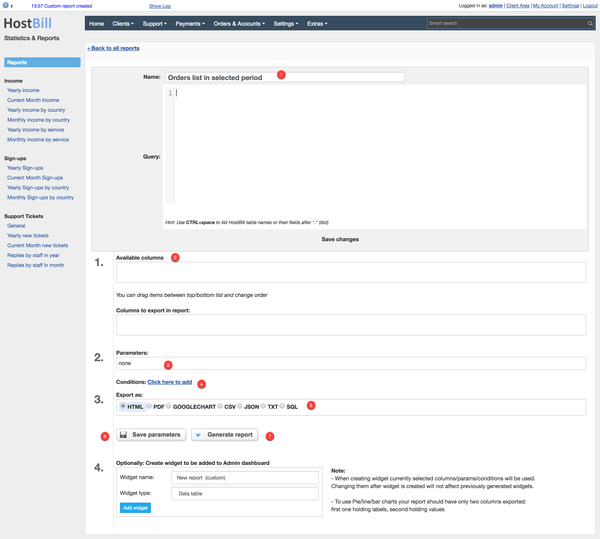
Where:
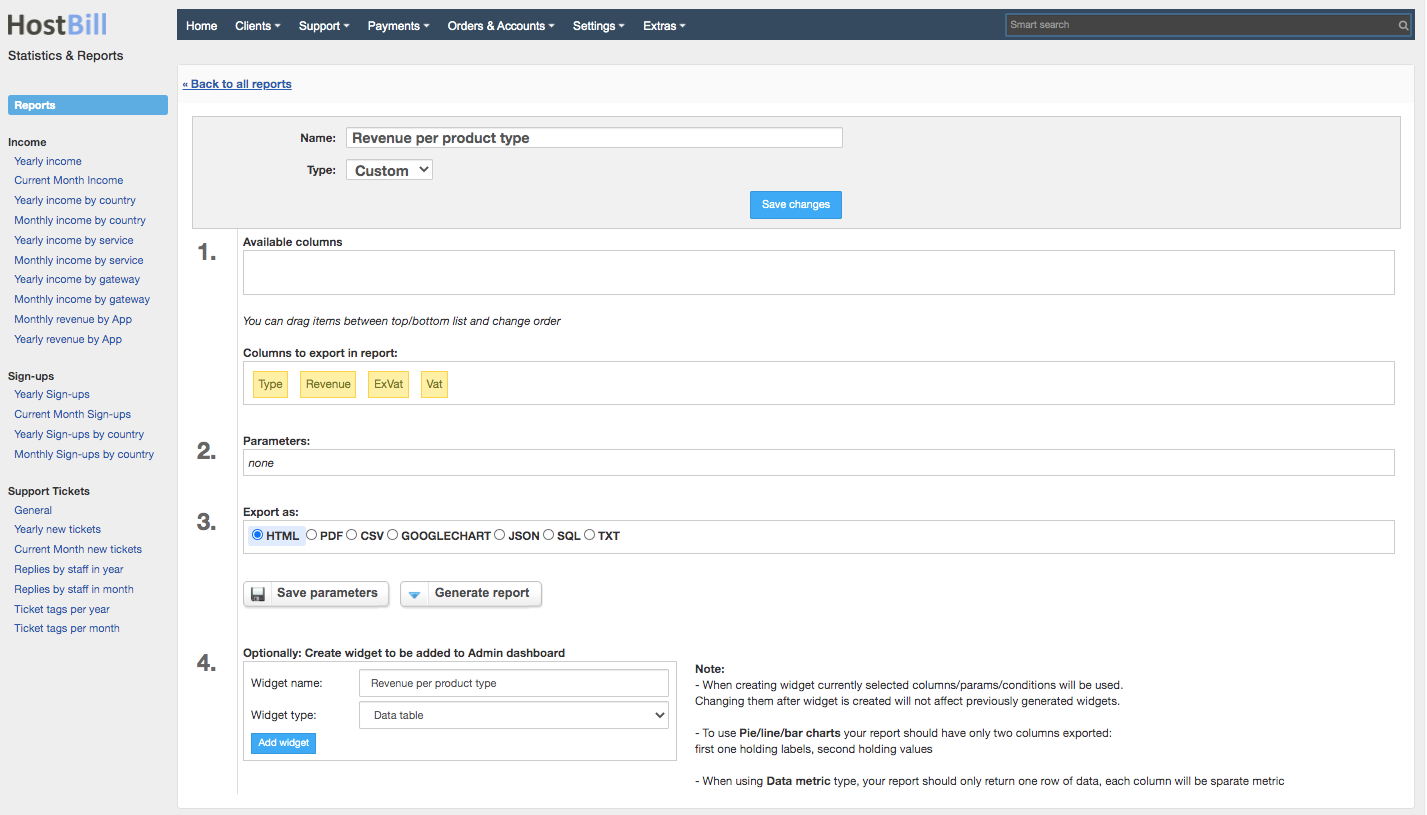
- Provide report name
- Choose the report type - group to which the report will be assigned
- Available columns - those are columns that are available in report. You can drag & drop available columns and columns to export in report. By dragging you can also change order of those columns
- Parameters of report - some reports allow you to enter parameters for report generation, those are mostly date conditions.
For date field, you can also use following variables (making the report more dynamic):- {$today} - current date
- {$current_month_start} - first day of current month
- {$current_month_end} - last day of current month
- {$previous_month_start} - first day of previous month
- {$previous_month_end} - last day of current month
- {$current_year_start} - first day of current year
- {$current_year_end} - last day of current year
- {$previous_year_start} - first day of previous year
{$previous_year_end} - last day of previous year
Info title Modifying date variables Optionally, you can use smarty modifier: datemove to further modify available variables.
{$variable|datemove:'modify by'}
Sample use cases:- {$today|datemove:'-1 day'} - take today variable, subtract 1 day from it
- {$current_year_start|datemove:'-10 years'} - take current year start, subtract 10 years from it
- {$current_year_end|datemove:'+5 years'|datemove:'-1 day'} - take current year end, add 5 years and subtract 1 day from it.
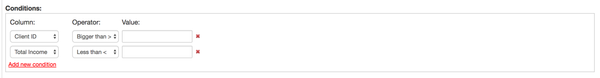
- Conditions box. Conditions allow you to enter certain report constrains on columns you've selected into export. Refer to screenshot below:
- Export as - here you can select a method of report export from available outputs: HTML, PDF, CSV, JSON, Googlechart, SQL or Plain Text
- Save parameters - to save from hassle of re-entering data, re-selecting columns etc. each time you want to export report, you can save current state for future use with this button
- Generate report - download/view report generated out of entered params/conditions
Create New Custom Report
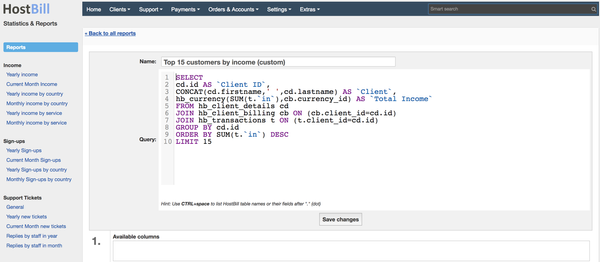
To create a new report simply click on Create new custom report button and you will be redirected to report configuration page. Best practice is to choose current report that uses data similar to what you're trying to achieve, and use "Customize" button next to it, allowing you to modify SQL query for this report.
Getting columns appear in Available columns
To have your columns appear in Available columns, make sure to add alias to each column using SQL keyword AS like
| Code Block | ||
|---|---|---|
| ||
SELECT id AS `Account ID` FROM hb_accounts |
Columns without aliases will not have option to export
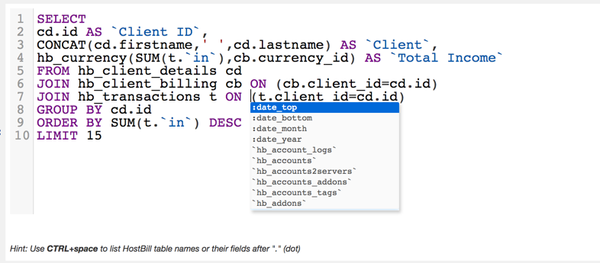
Query editor with SQL hints
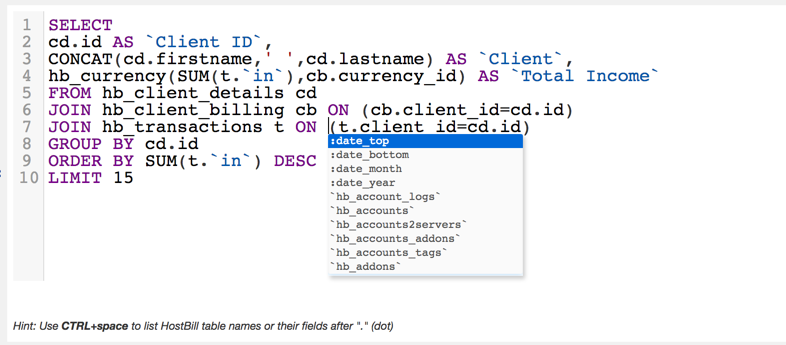
When editing SQL query using Reports section you'll be using editor with syntax highlighting and hints. Second feature is worth describing:
Listing database tables
In editor use CTRL(/Command)+Space combination - you'll be presented with list of all tables in your HostBill database - this way you will not be required to memorize all of them!

Listing table fields
After entering table name and "." dot symbol in SQL you're refering to table field - use CTRL+Space to see all available fields for this table
HostBill SQL functions
Adding to regular MySQL functions HostBill provides two custom functions you can call from your SQL queries:
- hb_currency(amount,currency_id,rate) - this function will format amount field to display currency prefix/suffix as configured. currency_id and rate are optional - if those are missing HostBill will use its main currency, otherwise it will display amount field with currency_id (see hb_currencies table) and rate conversion rate
- hb_date(date_field) - this function will return date field formatted with current HostBill date display settings
Example:
| Code Block | ||
|---|---|---|
| ||
SELECT hb_currency(total) AS `invoice total`, hb_date(date) AS `invoice date` FROM hb_invoices |
Please note - those functions work from reports scope only - calling them on DB directly will not work.
Creating admin-dashboard widget
While working with reports you can save current report columns, parameters and conditions into a widget to be displayed on dashboard. After setting report as described above, proceed to section 4. of report editor: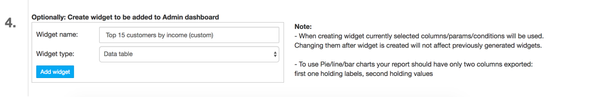 You . Here you can enter:
- Widget name - text representiation of report, to be refered to later in dashboard widget
- Widget type - depending on data you wish to present, select one of following:
- Data table
- Pie chart
- Bar graph
- Line graph
Note:
- When creating widget currently selected columns/parameters/conditions will be used. Changing them after widget is created will not affect previously generated widgets.
- To use Pie/line/bar charts your report should have only two columns exported: first one holding labels, second holding values
- When using Data metric type, your report should only return one row of data, each column will be separate metric
Once ready click "Add widget" to store report widget.
Below widget setup box you can work with Previously created widgets (remove them).
Note that if your mysql query for report has changed, you most likely will need to re-create them.